


Accurate, fast and secure email verification service
Verify email lists instantly — reduce bounces, clean data, and protect your sender reputation.
Ask AI about Email Awesome
© 2026 Email Awesome. All rights reserved.


The average email open rate in 2026 is 43.46%. That number is in every benchmark report you'll find this year. And it's misleading.
Apple Mail Privacy Protection pre-loads tracking pixels on every email opened in Apple Mail, registering it as "opened" whether a human ever read it or not. The result: open rates across the industry are inflated by an estimated 15 to 20 percentage points. The real human engagement rate for most lists sits closer to 25 to 30%. Marketers optimizing for open rates are chasing a metric that no longer reflects what they think it does.
The email marketing benchmarks that actually matter in 2026 are CTR (because it requires a deliberate click) and bounce rate, because crossing the wrong threshold now gets you permanently blocked by Gmail and Microsoft. Here's the email marketing benchmarks that actually matter, the thresholds, and what to do when your numbers don't line up.
Before comparing your metrics against email marketing benchmarks, it helps to know what each metric actually measures and where the data breaks down.
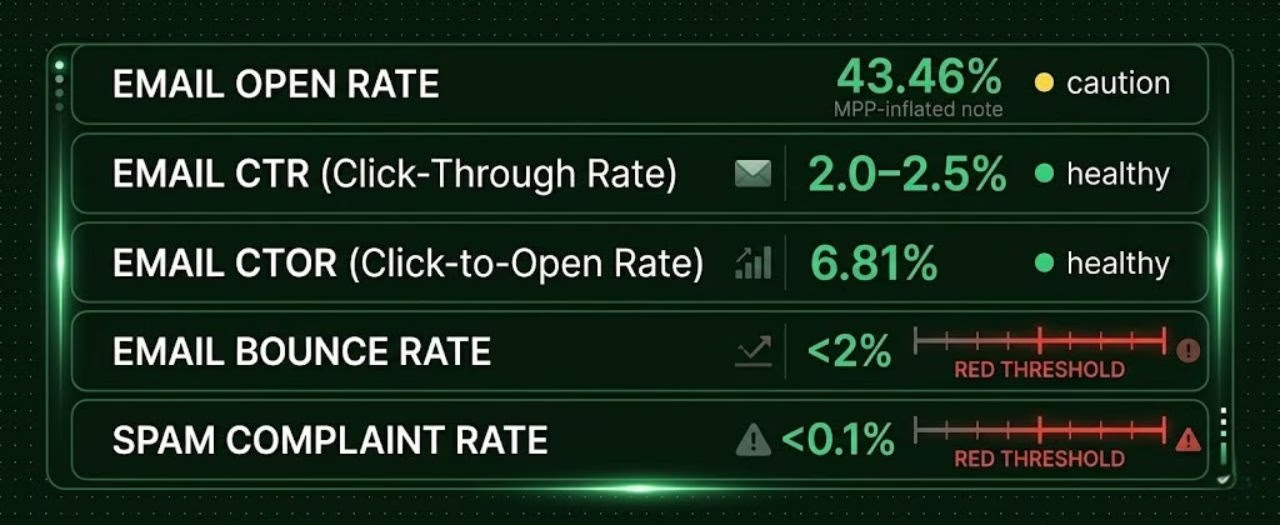
Open rate measures the percentage of delivered emails that were opened, calculated as unique opens divided by delivered emails. For email marketing benchmarks, the global average open rate across all industries is 43.46% according to MailerLite's 2026 benchmark report, based on 3.6 million campaigns from 181,000+ accounts.
That number includes Apple MPP inflation. Strip out the artificial opens and the real engagement rate is closer to 25 to 30% for most lists. Only 15% of email marketers now treat open rate as a primary performance metric. The rest have moved on.
CTR measures the percentage of total recipients who clicked any link, calculated as unique clicks divided by delivered emails. It requires a deliberate action from a real human, which makes it the most reliable engagement benchmark in 2026.
Global average for broadcast campaigns: 2.0 to 2.5%. Automated flows average significantly higher: Klaviyo's 2026 data puts flow CTR at 5.58% versus 1.69% for manual campaigns. Always compare against the right email type.
CTOR measures the percentage of openers who clicked, calculated as unique clicks divided by unique opens. It isolates content quality from deliverability by filtering to people who already showed enough interest to open. Global average: 6.81% in 2026, up from 5.63% in 2024 (MailerLite). Note: because CTOR's denominator includes MPP-inflated opens, actual CTOR is higher than reported.
Bounce rate is the percentage of emails that failed to deliver. Hard bounces are permanent failures: invalid addresses, non-existent domains, deactivated mailboxes. Soft bounces are temporary: full inboxes, server timeouts. The industry threshold for a healthy hard bounce rate is below 2%. In 2026, crossing that threshold has regulatory consequences covered in detail below.
Spam complaint rate is the percentage of delivered emails that recipients marked as spam. The acceptable threshold is below 0.1%. Google recommends keeping it below 0.08% to stay well clear of enforcement. Rates above 0.3% trigger active enforcement from both Gmail and Microsoft.
The email marketing benchmarks data below consolidates ranges from Mailchimp's Email Marketing Benchmarks, MailerLite's 2026 Industry Report, and Validity's 2025 Email Deliverability Benchmark Report. Open rates reflect MPP-inflated figures as reported by ESPs. Real human engagement rates are lower across all industries.
Three industries consistently record the highest bounce rates: Recruiting and HR, B2B Sales and Lead Generation, and Real Estate. They share a single cause: contact data sourced from third-party databases, purchased lists, or portal exports where addresses are never confirmed as valid. Staff turnover compounds the problem: business email addresses deactivate within days of a job change, and B2B lists built from external sources reflect that churn continuously.
The three industries with the lowest bounce rates share the opposite characteristic: Education, Nonprofits, and SaaS companies with real-time signup verification all build lists through opt-in with address validation at the point of capture. The list quality difference is structural, not accidental.
Most email marketing benchmarks reports give you industry averages but bury the B2B versus B2C split in a footnote. That split matters more than the industry average for most teams.
B2B and B2C email programs solve different problems, which is why their benchmarks diverge structurally. B2B emails target decision-makers with longer buying cycles, smaller and more carefully built lists, and content designed to educate before converting. B2C emails target consumers with immediate purchase intent, larger lists with higher churn, and content optimized for quick action.
The result: B2B campaigns achieve 60% higher CTR than B2C on average, according to Mailchimp's benchmark data. But B2B buyers need 6 to 8 email touches before responding, compared to 1 to 3 for B2C. Higher CTR per email, but longer nurture sequences before conversion.
Here's the scenario that trips up B2B teams regularly. An SDR manager reviews their cold outreach numbers: 3.2% CTR, 0.4% bounce rate, 0.07% spam complaints. They pull a B2C benchmark report showing an industry average CTR of 2.0 to 2.5% and assume their 3.2% is only slightly above average. In B2B cold outreach, 3.2% CTR is a strong result, well above the category average. Comparing against B2C benchmarks made a high-performing program look mediocre. Always match the benchmark to the email type.

In 2026, the email marketing benchmarks that carry real consequences are bounce rate and spam complaint rate. They are compliance thresholds, not just performance metrics. Crossing them doesn't mean your campaign underperformed. It means your next campaign may not deliver at all.
What bounce rate triggers permanent rejection from Gmail in 2026? A bounce rate above 2% triggers permanent 5xx rejections from Gmail as of November 2025. Not temporary delays, but outright delivery failures. Microsoft enforces the same threshold with immediate 550 5.7.515 error codes since May 2025. These rejections don't reset after the offending campaign ends. They compound, damaging your sender reputation across your entire domain and affecting every send that follows, which is why email deliverability starts with list hygiene, not subject line optimization.
The enforcement timeline matters: Google moved from temporary deferrals to permanent rejections in November 2025. See Google's Email Sender Guidelines. Microsoft's enforcement began May 5, 2025. A spam complaint rate above 0.3% triggers active enforcement from both providers, directly reducing inbox placement rates across your domain. Not a warning, an action.
Email open rates averaged 43.46% across industries in 2026, but Apple Mail Privacy Protection inflates that figure by an estimated 15 to 20 percentage points by pre-loading tracking pixels on Apple Mail clients. The real human open rate for most lists is closer to 25 to 30%. Click-through rate — which requires a deliberate action — is the more reliable benchmark, averaging 2.0 to 2.5% for broadcast campaigns.
In 2026, bounce rate and spam complaint rate are no longer just performance metrics, they are compliance thresholds. Google permanently rejects emails from senders whose bounce rate exceeds 2% as of November 2025. Microsoft enforces the same threshold with immediate 550 5.7.515 rejections since May 2025. A spam complaint rate above 0.3% triggers enforcement from both providers. EmailAwesome users maintain an average bounce rate below 1% through pre-send verification.
B2B and B2C email benchmarks differ fundamentally. B2B campaigns average 20 to 25% open rates, 2.5 to 3.5% CTR, and 0.35 to 0.5% bounce rates. B2C campaigns average 25 to 35% open rates (MPP-inflated), 1.5 to 2.5% CTR, and 0.5 to 1.5% bounce rates. B2B emails achieve 60% higher CTR than B2C on average, but require longer nurture sequences — B2B buyers need 6 to 8 email touches before responding compared to 1 to 3 for B2C.
The number most senders don't know: 39% of email marketers rarely or never conduct list hygiene, according to Validity's 2025 Benchmark Report. That means nearly 4 in 10 senders are operating with lists that are chronically near the bounce threshold without realizing it. For B2B teams with contact data from Apollo or ZoomInfo, where list decay runs at 20 to 30% annually, that gap closes faster than most expect.
In EmailAwesome, we process over 10 million email addresses daily. Users who verify their lists before each major send maintain an average bounce rate below 1%, half the threshold that Google and Microsoft consider safe. That's not a floor. It's the practical result of removing hard-bounce candidates before they count against your reputation.
Start cleaning before you cross the line. Clean Your List Free →
Below-average email marketing benchmarks have specific causes. Most trace back to email list hygiene, or the lack of it. The fixes are more targeted than most guides suggest.
1. Verify your list before every major send
The single highest-ROI action for bounce rate and spam complaints. Email verification removes invalid addresses, disposables, and spam traps before they affect your metrics. It's the only action that improves bounce rate, deliverability, and CTR simultaneously, by shrinking the denominator to addresses that can actually receive your message.
Hard bounces from invalid domains, especially common in B2B lists from Apollo or ZoomInfo exports — are caught at the MX record lookup layer of the verification pipeline, before any SMTP connection is attempted.
2. Segment by engagement level
Sending the same message to your entire list is the fastest way to pull your averages down. Segment by recency of last click, not last open. MPP makes open-based segmentation unreliable. Subscribers who clicked in the last 90 days are your active list. Everyone else needs a re-engagement sequence before the next campaign send.
3. Replace open rate with CTR as your primary KPI
Apple MPP has made open rate a lagging indicator of reality. Teams still reporting to stakeholders on open rate alone are presenting data that includes 15 to 20 points of phantom activity. Shift reporting to email click-through rate, CTOR, and revenue per email. These metrics reflect actual behavior.
4. Run a re-engagement sequence before suppressing inactives
Before removing subscribers who haven't engaged in 6 months, run a 2 to 3 email re-engagement sequence with a clear subject line and a single CTA. Triggered re-engagement campaigns result in 8 to 12% retention recovery, according to SQ Magazine's B2B email research. Suppress the non-responders after the sequence, not before.
5. Verify your authentication setup
SPF, DKIM, and DMARC authentication is now mandatory for bulk senders on Gmail, Yahoo, and Microsoft. Emails sent from authenticated domains are 2.7x more likely to reach the inbox. If you haven't confirmed your authentication setup, that's the first fix. It costs nothing and affects every email you send.
Pro Tip: "The fastest way to improve your benchmarks isn't a better subject line — it's a cleaner list. Removing invalid addresses before you send is the only action that simultaneously improves bounce rate, deliverability, and CTR."
EmailAwesome processes lists of up to 20,000 contacts in under 10 minutes. Unknown results are never charged.
Your dashboard open rate is almost certainly wrong. Apple MPP, Google's similar privacy protections, and bot filtering have collectively made the headline number every email marketer has reported for a decade into a metric that no longer means what it used to.
The numbers that are still accurate, and now matter more than ever, are CTR, bounce rate, and spam complaint rate. Two of those three have regulatory consequences in 2026. Cross the bounce rate or spam complaint threshold and Gmail and Microsoft don't warn you. They block you.
The practical email marketing benchmarks strategy: maintain email bounce rate below 1% and spam complaint rate below 0.1% on every send. Everything else follows. Email deliverability improves, inbox placement improves, and your CTR benchmarks against industry averages without the distortion of delivering to addresses that can't receive your message.
Start with 1,000 free verifications →
Check the most Frequently Asked Questions
What is a good email open rate in 2026?
What is the average email click-through rate by industry?
What is an acceptable email bounce rate?
What email marketing benchmarks differ between B2B and B2C?
How do spam complaint rates affect email deliverability?
Accurate, fast and secure email verification service
Verify email lists instantly — reduce bounces, clean data, and protect your sender reputation.
Ask AI about Email Awesome